How to plot graph in Matlab using excel or csv data?
This tutorial is designed to explain how to plot multiple graphs in Matlab using data or matlab multiple plots in one graph or in one figure. To plot any graph in Matlab you need a software Matlab already installed. After installing that software you must have data in CSV or txt format which you are going to plot. The data can be 2d, 3d etc. This tutorial is divided into 3 sections.
Section 1. Plot 2D graph
Step1: Create a Matlab m file.
Step2: Load data into M file.
To load a csv data, available in txt or excel format, you need following commands as shown below.
Step3: Get the graph
- Save the m file and run the script. You will be prompted another window which gives the actual graph you require.
Fig 1.3 Output after run.
Note: Before running the file. you must use "add to path" you should add the folder where the data file is placed.
Step4: Post process graph as per need.
- For post processing use Matlab graph editing feature: Show plot tools and dock figures.
- This can be seen below in figure 1.4
Step5: Save it.
- Picture can be saved in high resolution as per need.
2. Plot Multiple Graphs on single window.
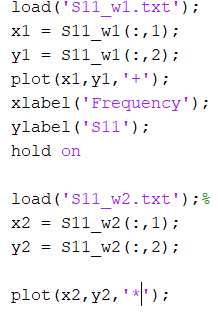
- To plot multiple graphs in single window the above commands are replicated in same file along with hold on command.The code for that is given below. The remaining steps should be repeated to do the process.
Fig 2.1 Commands to plot multiple graphs
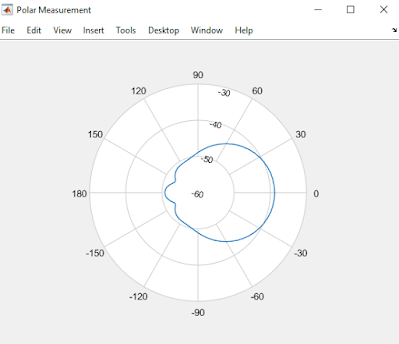
3. Polar Plot in Matlab
- To plot the polar graph you must have MATLAB 2017 version or above. The command "polarpattern" used to plot the polar graph does not work in earlier versions.
Fig 3.1 Commands to plot polar graphs


0 Comments